
Task
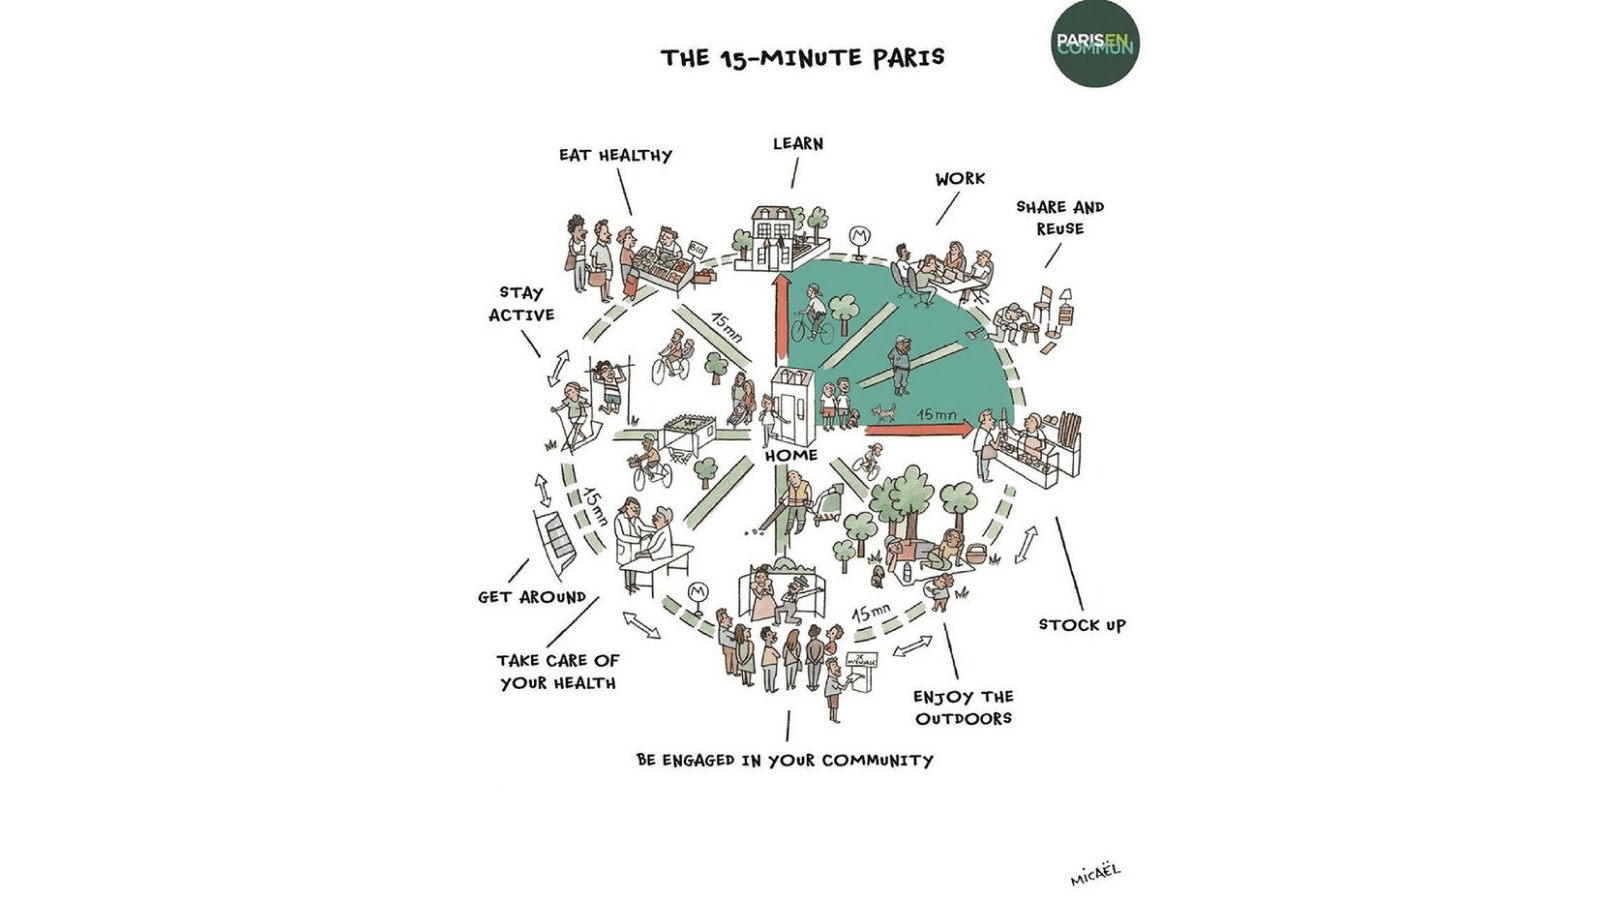
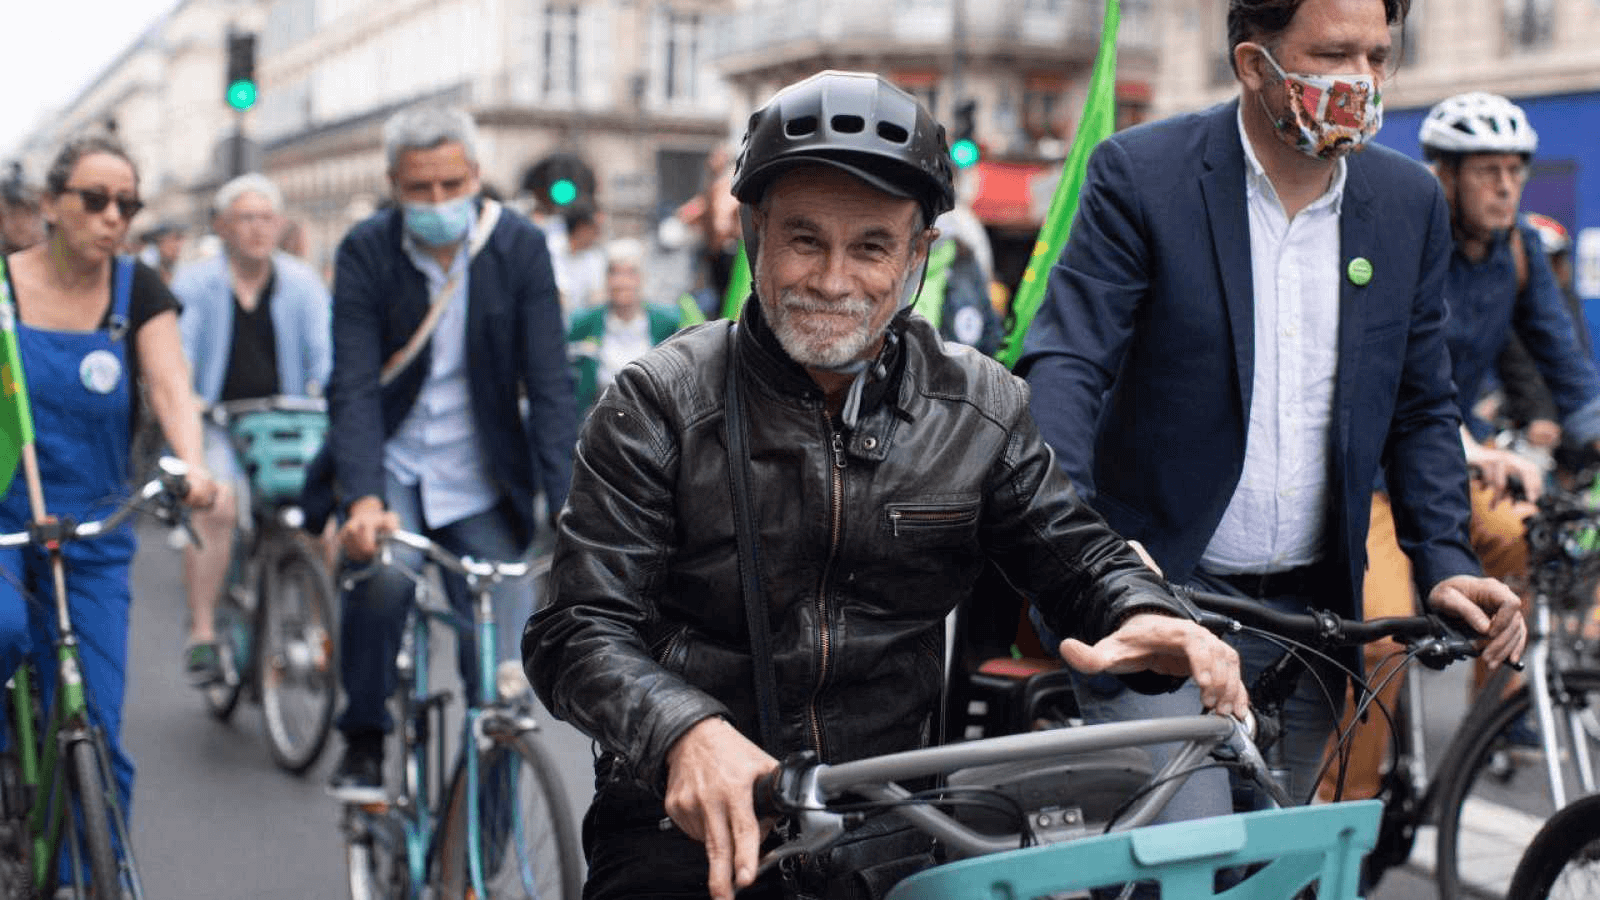
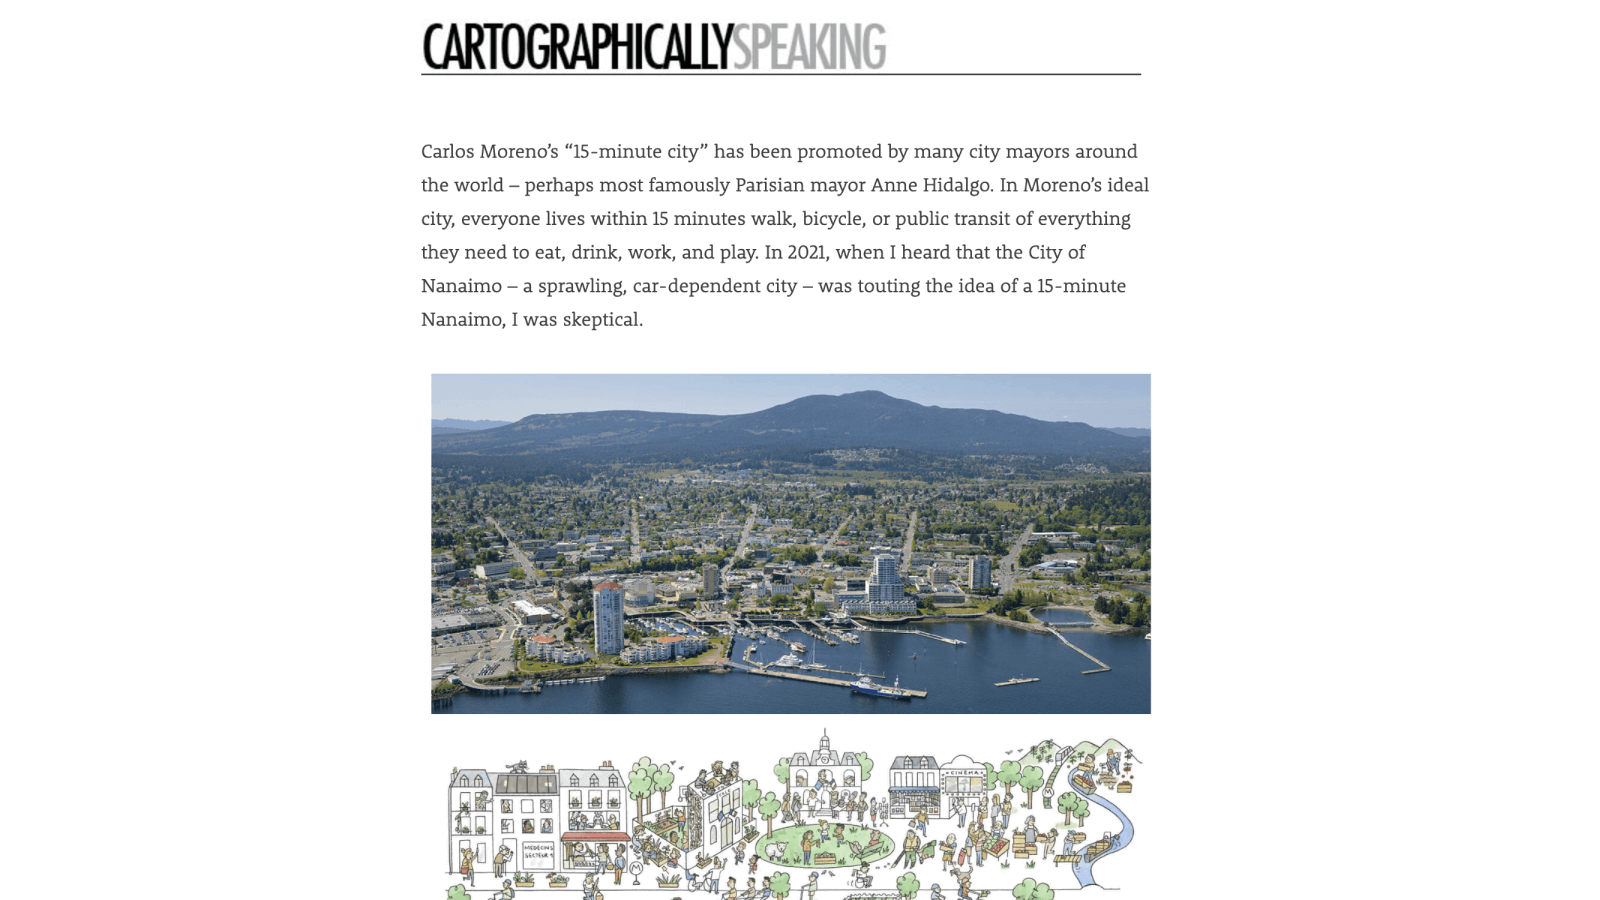
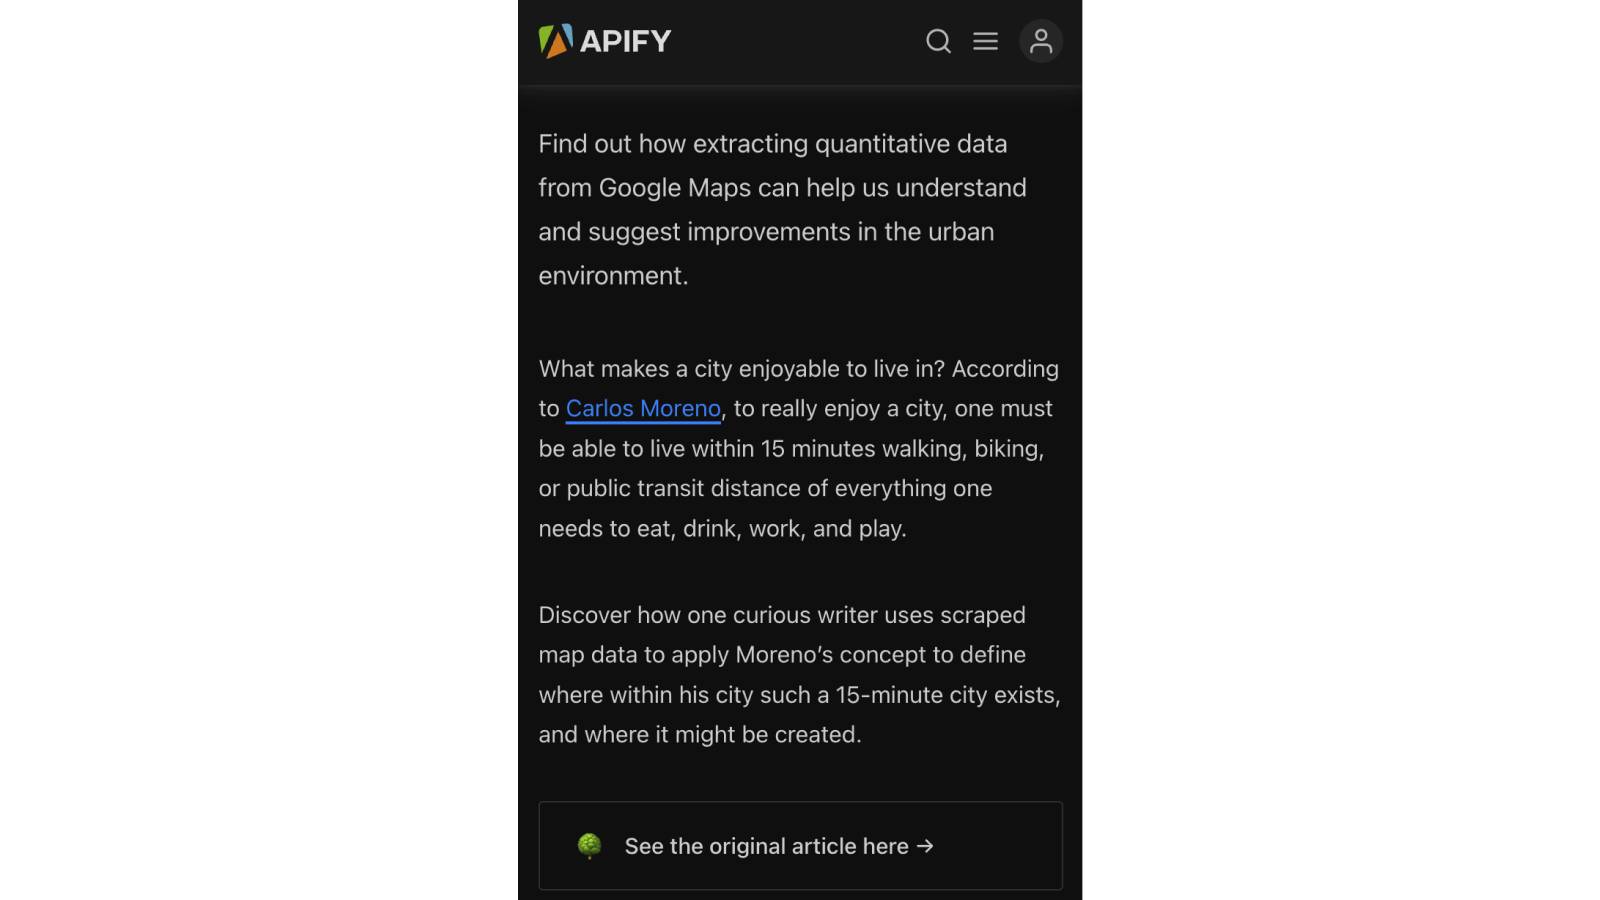
Carlos Moreno's “15-minute city” has been promoted globally – perhaps most famously by
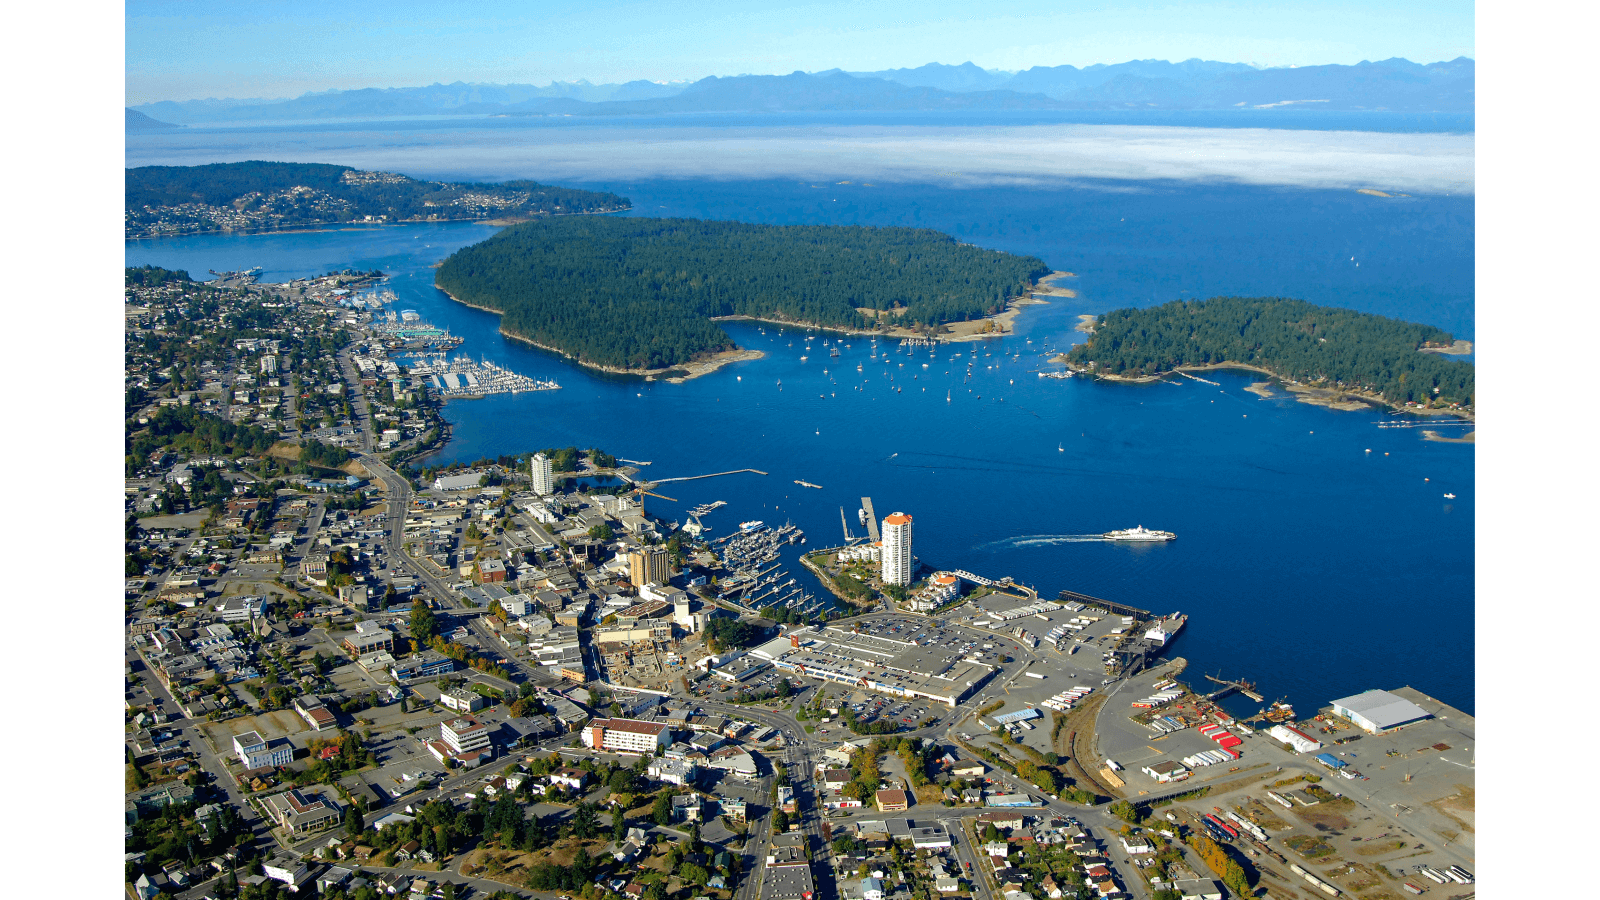
Parisian mayor Anne Hidalgo. When the sprawling, car-dependent City of Nanaimo began
touting its 15-minute aspirations, I wondered if I could evaluate - in real numbers -
how
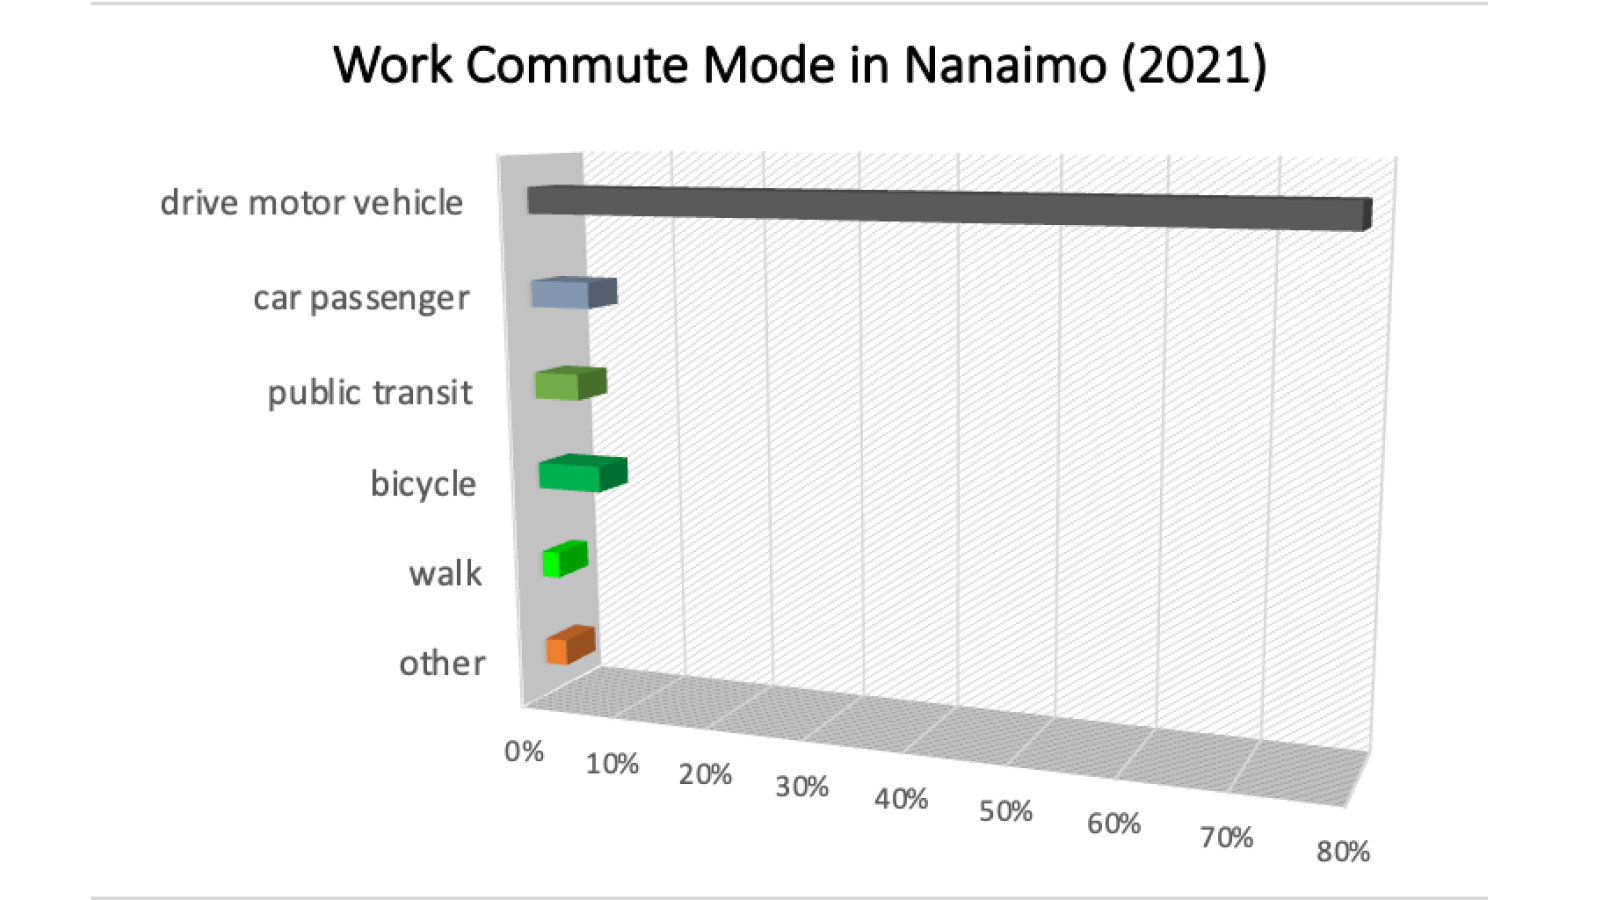
close or far a city is from approximating Moreno’s model. It seemed obvious
that a city with Walk, Bike, and Public Transit Scores in the mid-30s could not possibly
be a 15-minute city overall. But what about certain city districts? Were some
neighborhoods
more car-dependent than others? And if they were, could this be changed?
Process
How to capture where a 15-minute city in fact exists? What essential and basic quality
of
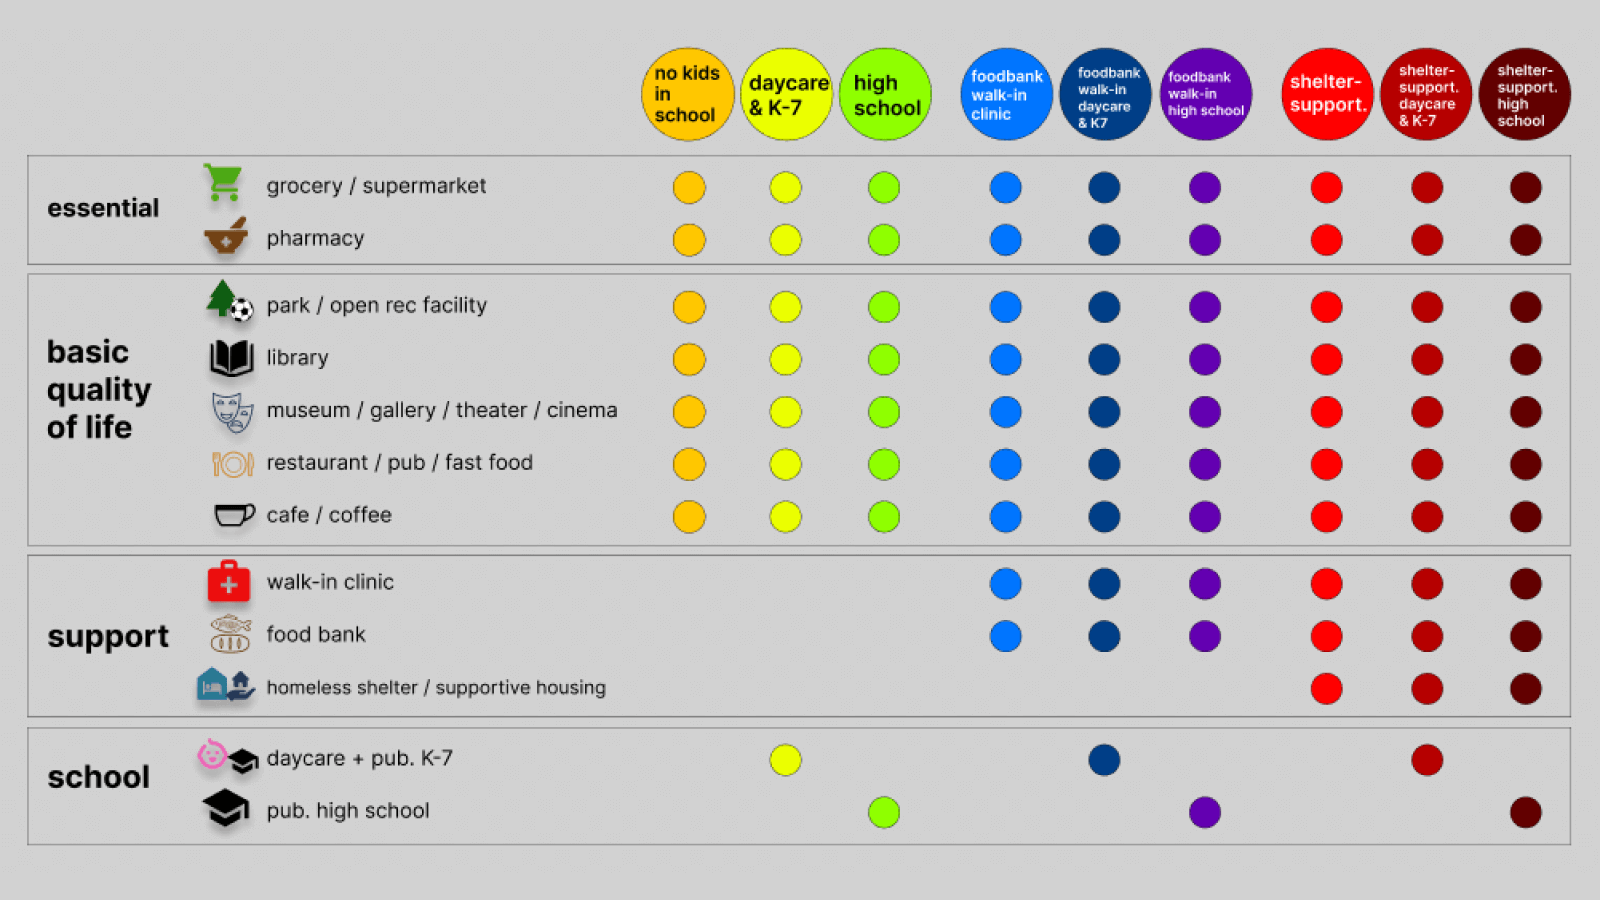
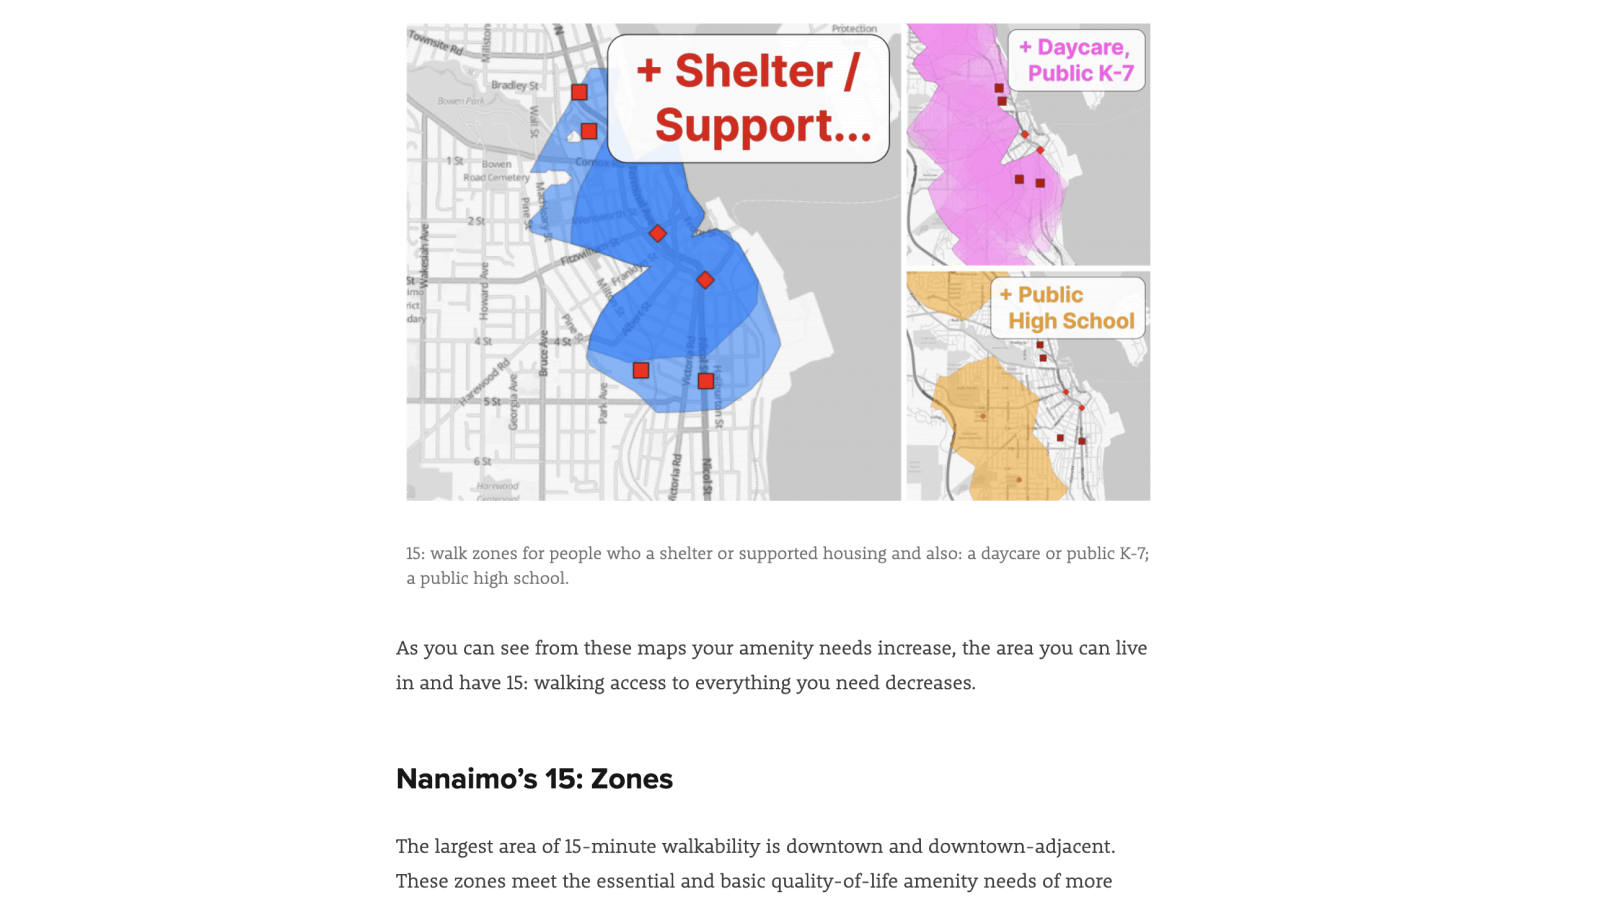
life amenities make a 15-minute city at a minimum? Different people need different
things –
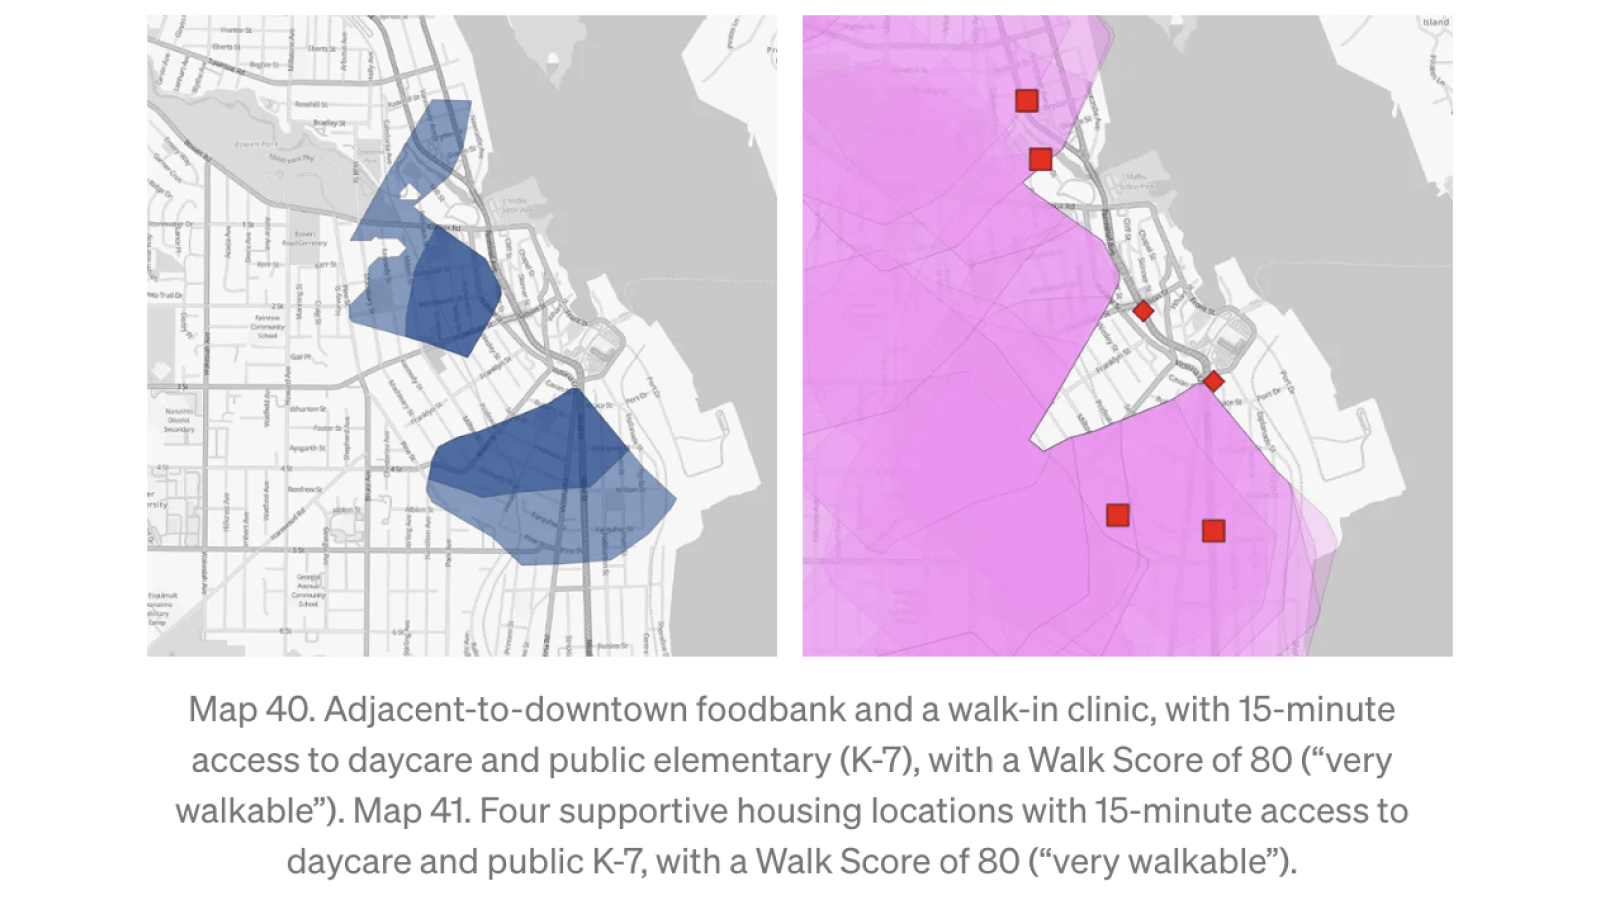
school, walk-in clinic, foodbank, supported housing, shelters, and so on; to have
15-minute
walking access to everything they need, they have to live in different places. So I
worked
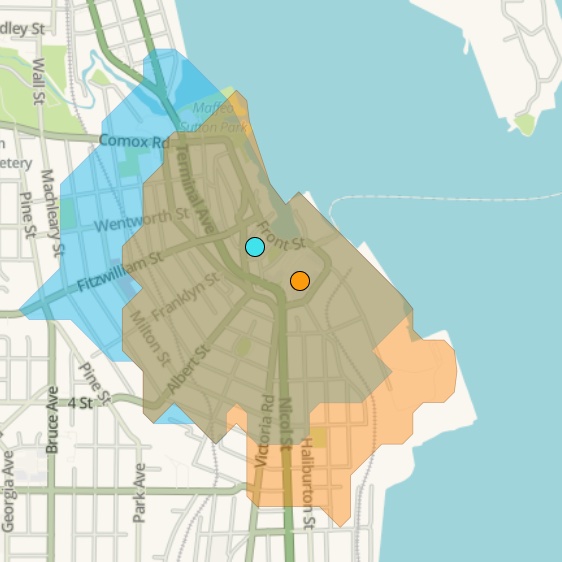
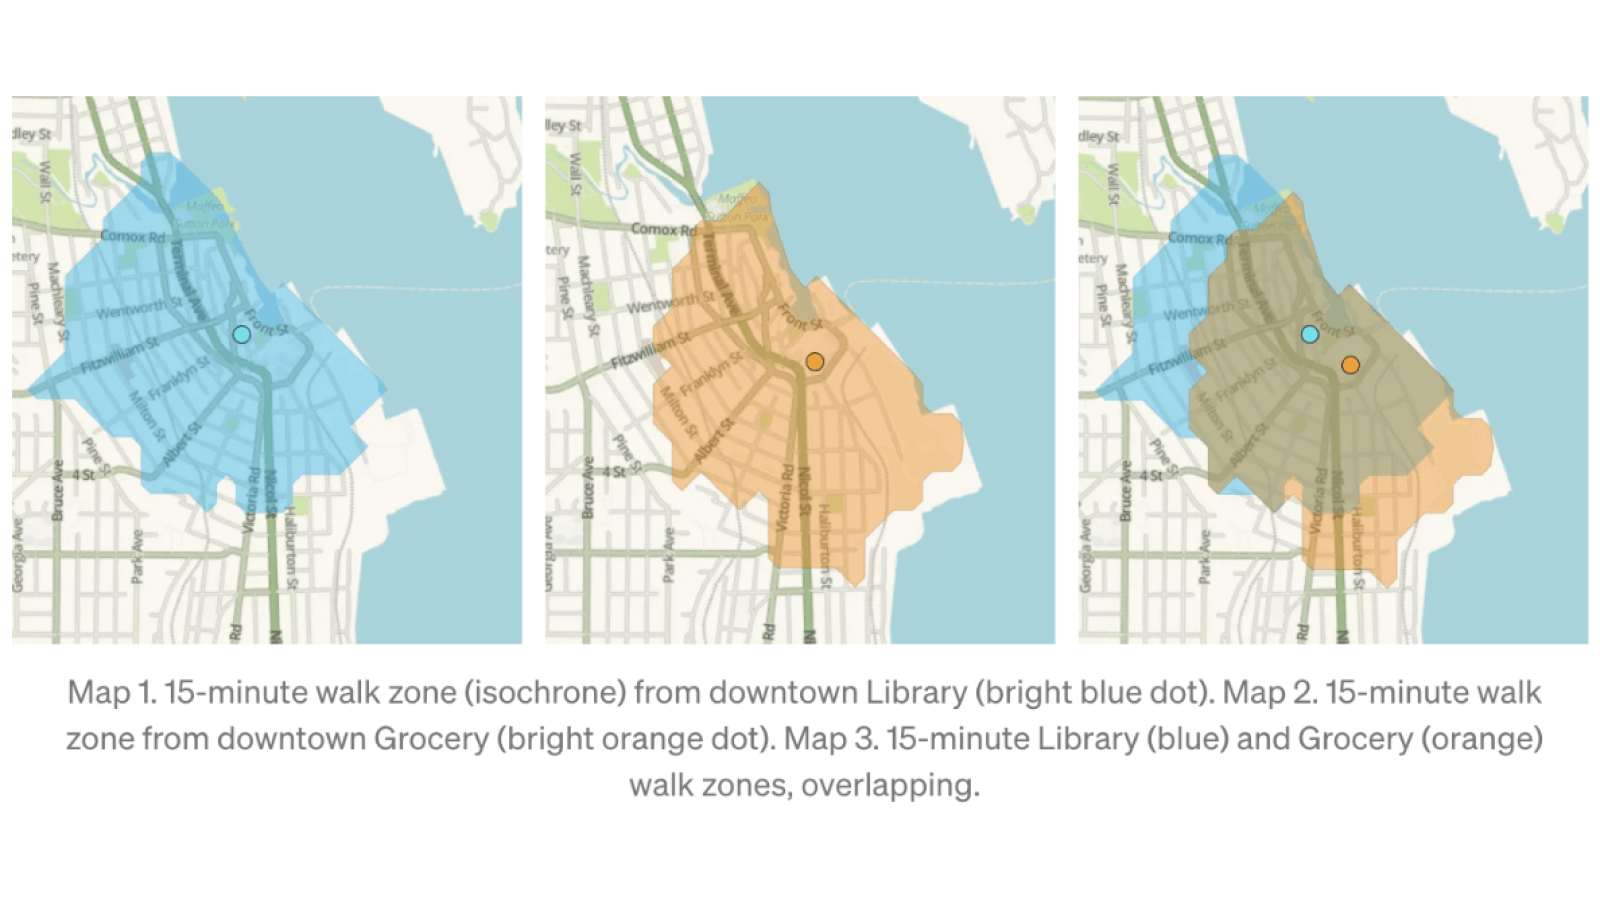
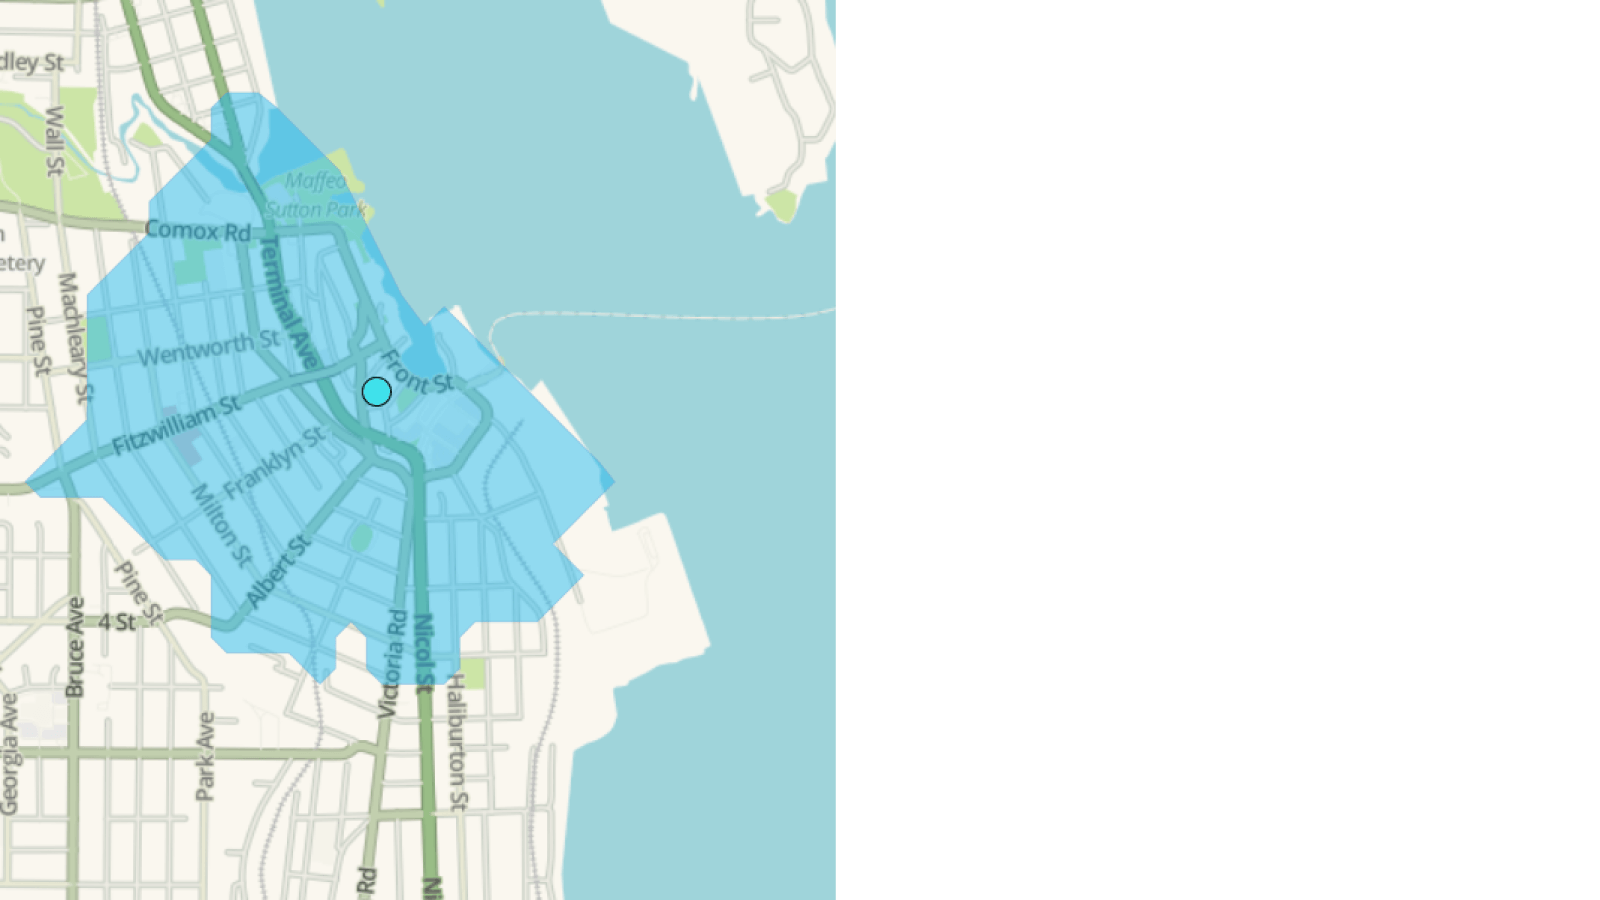
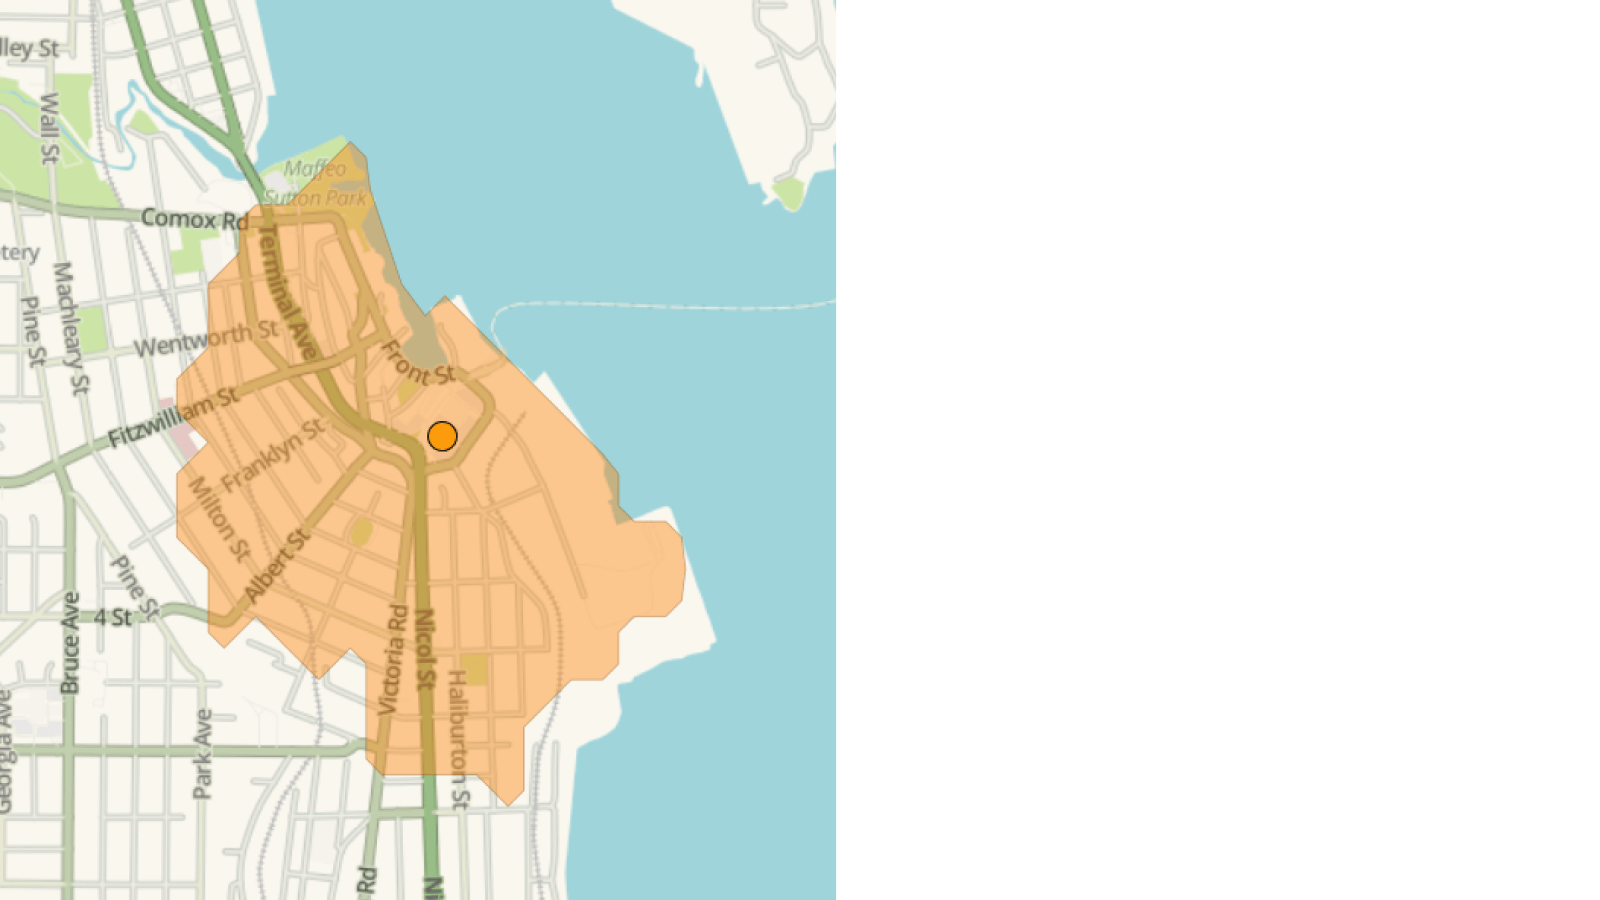
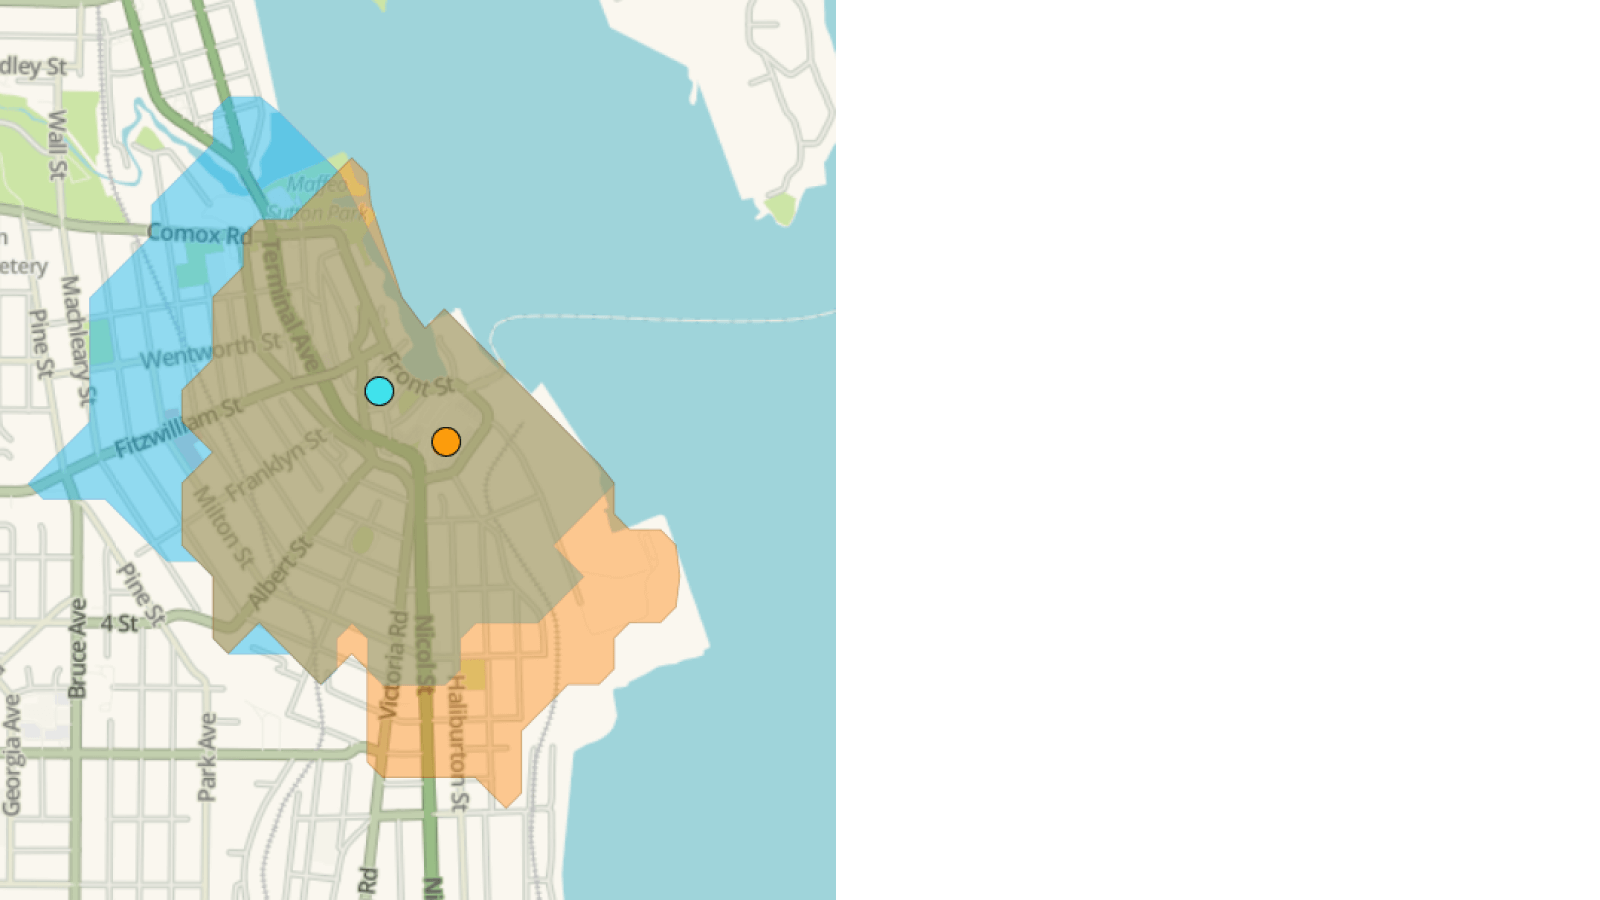
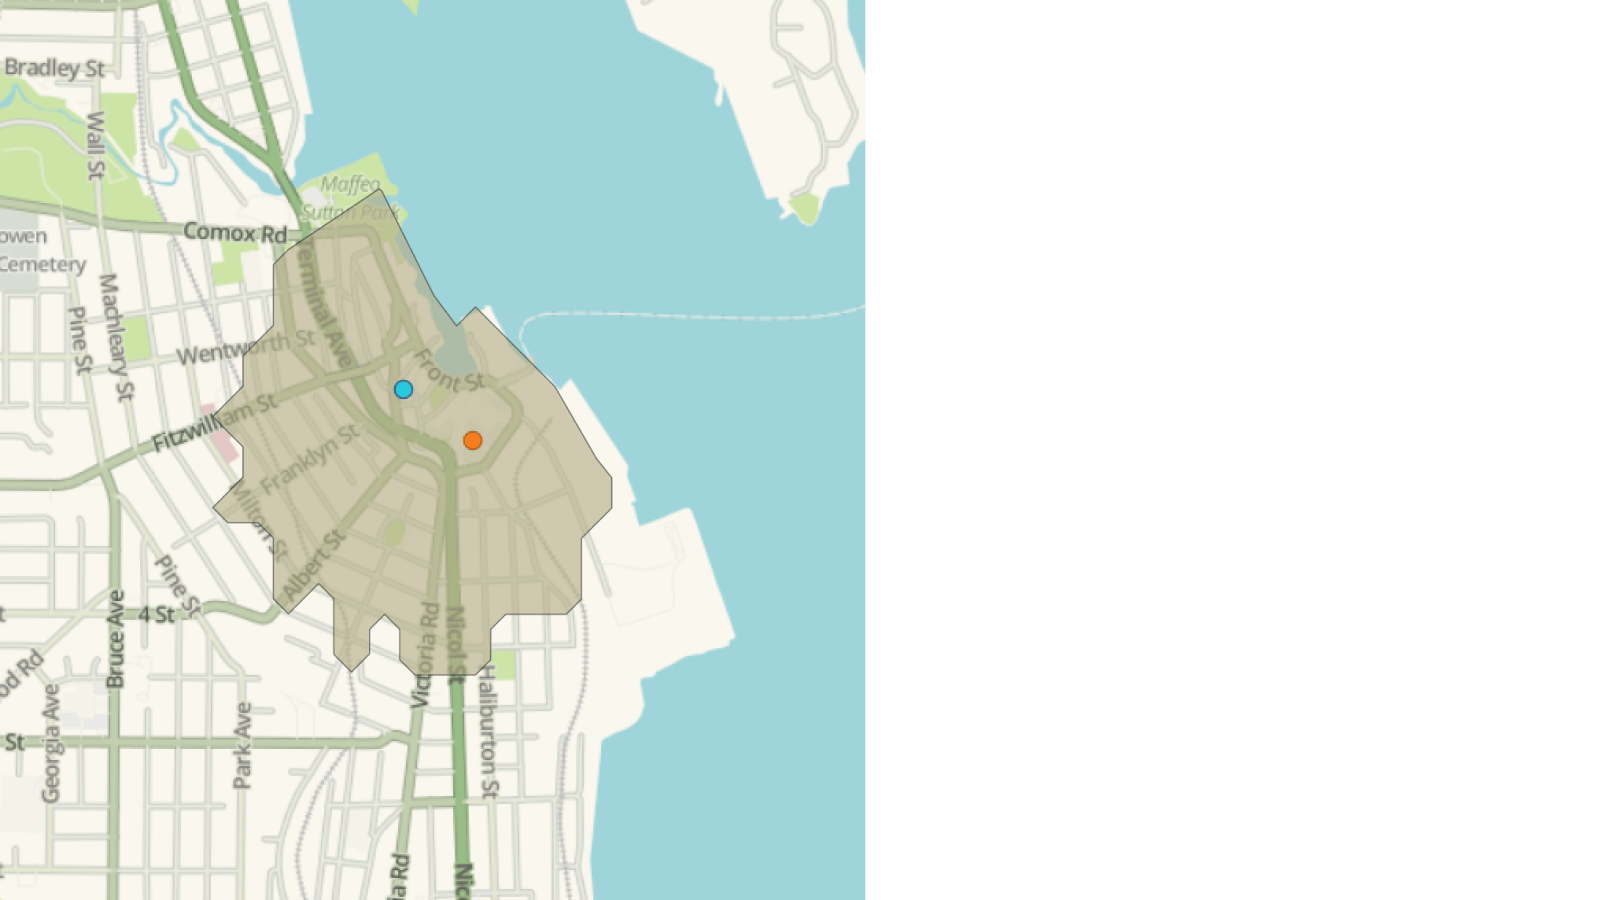
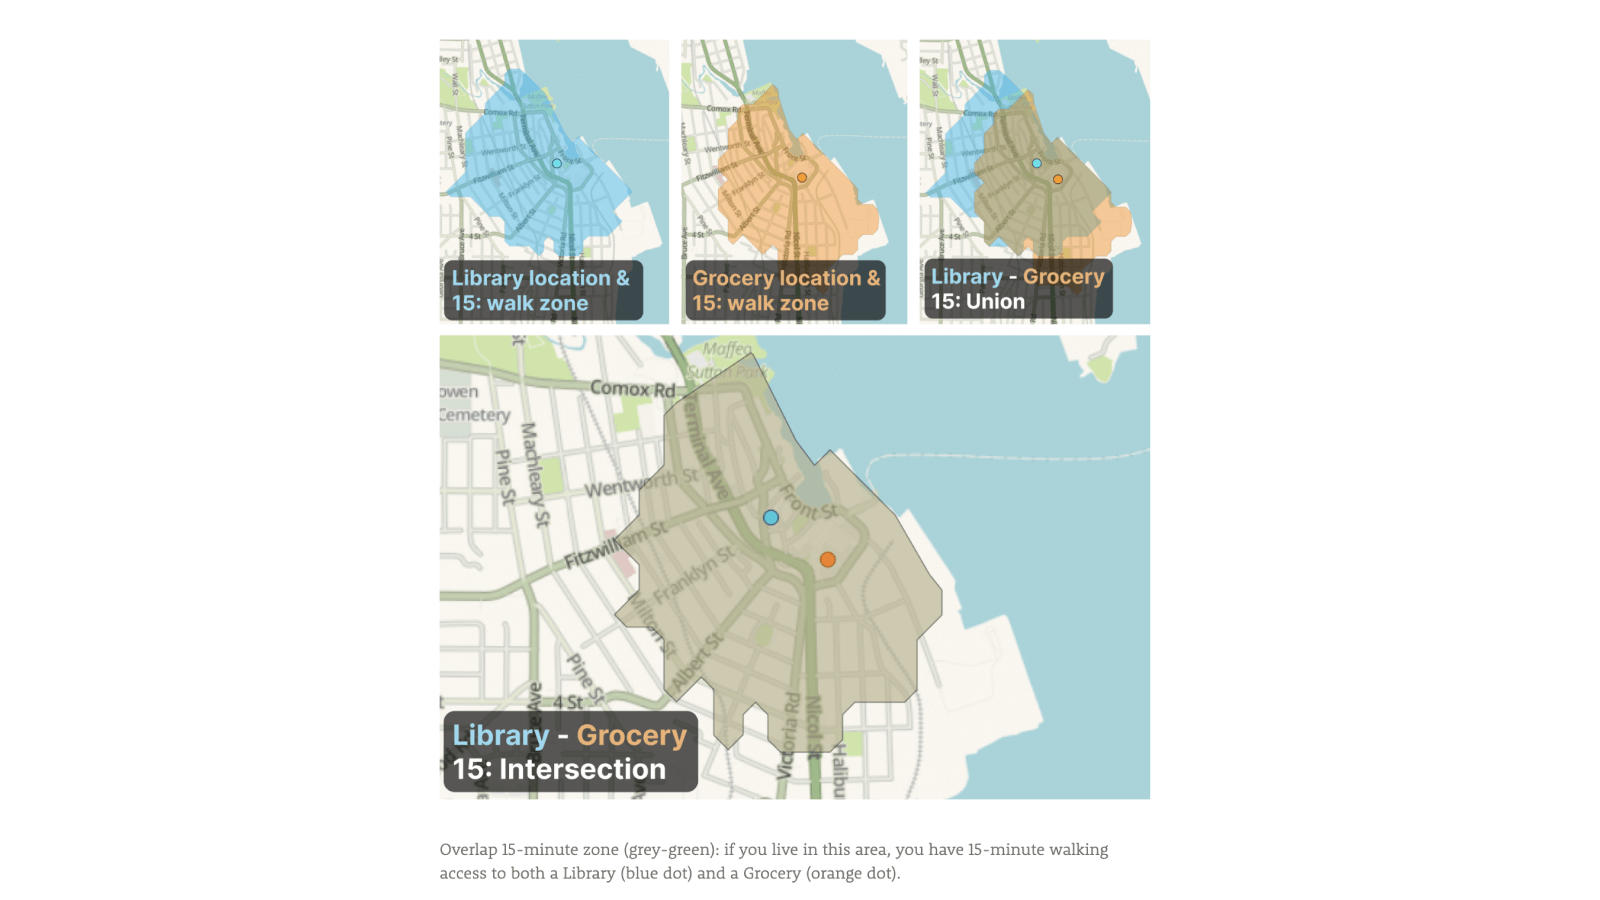
backwards from group-specific need-baskets - 1. scrape for amenity locations, 2. map
15-minute walking isochrone zones around those locations, 3. find amenity isochrone
overlaps
for amenity baskets / groups.
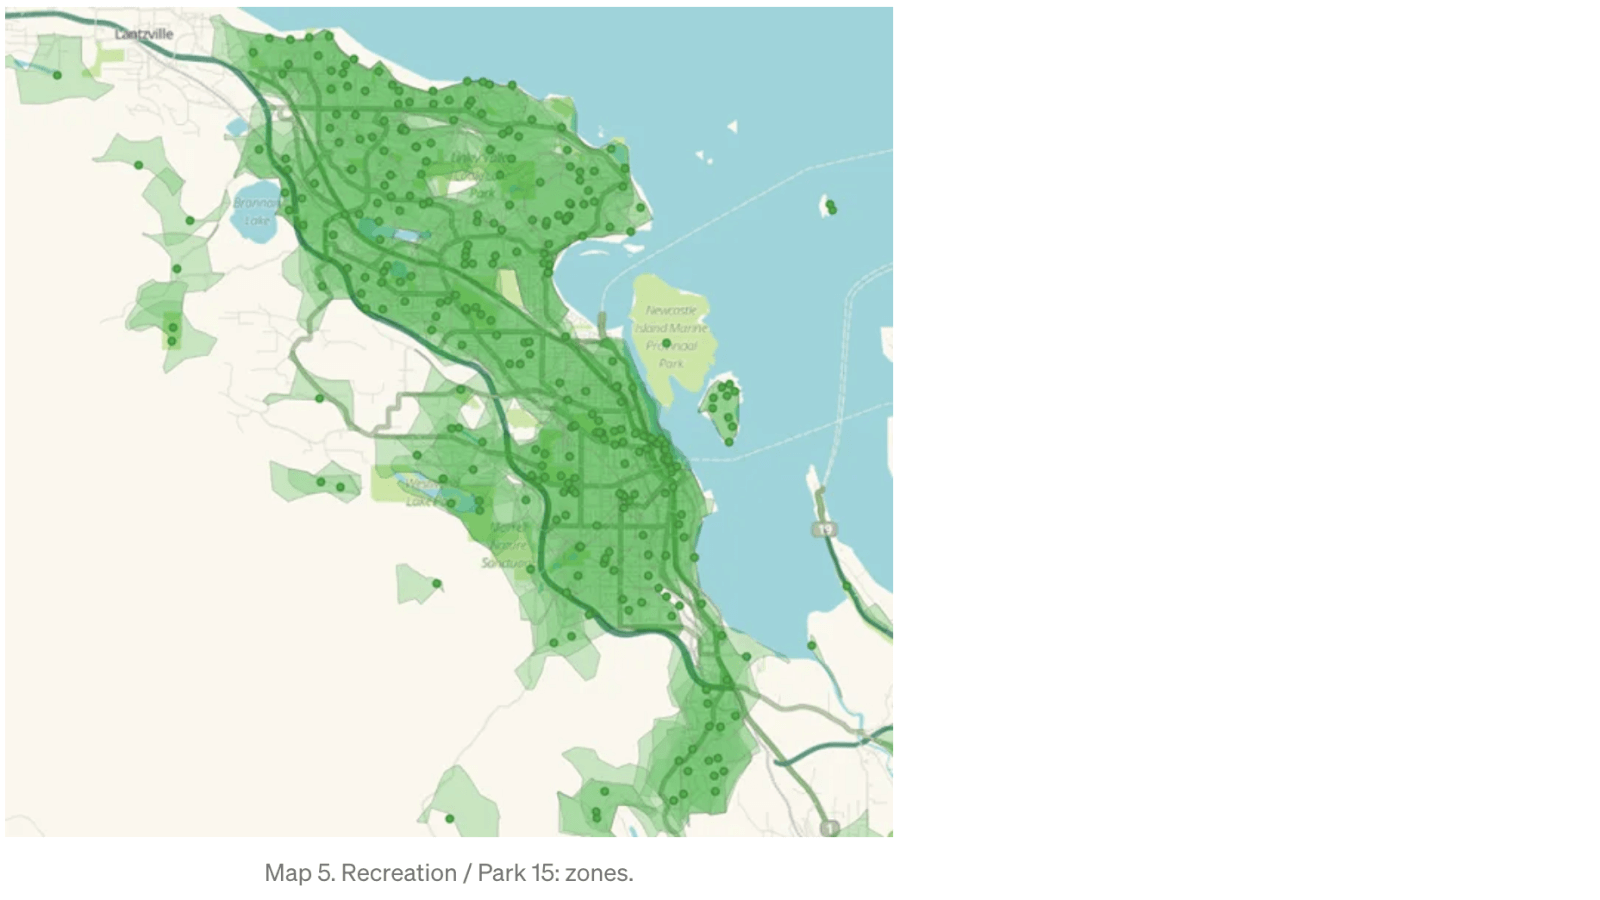
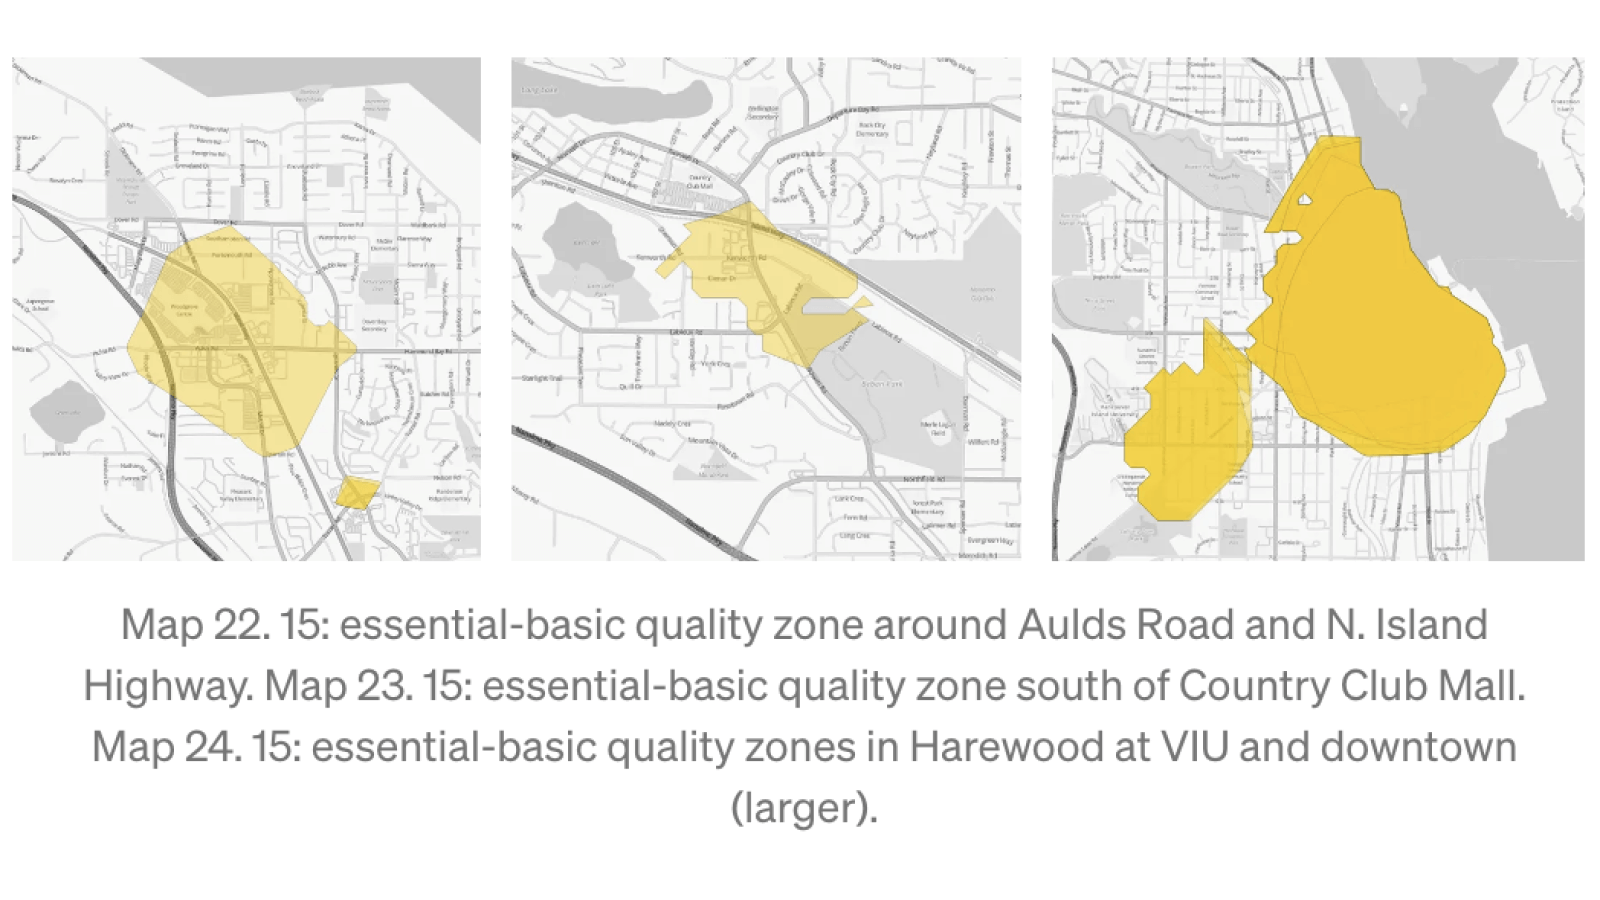
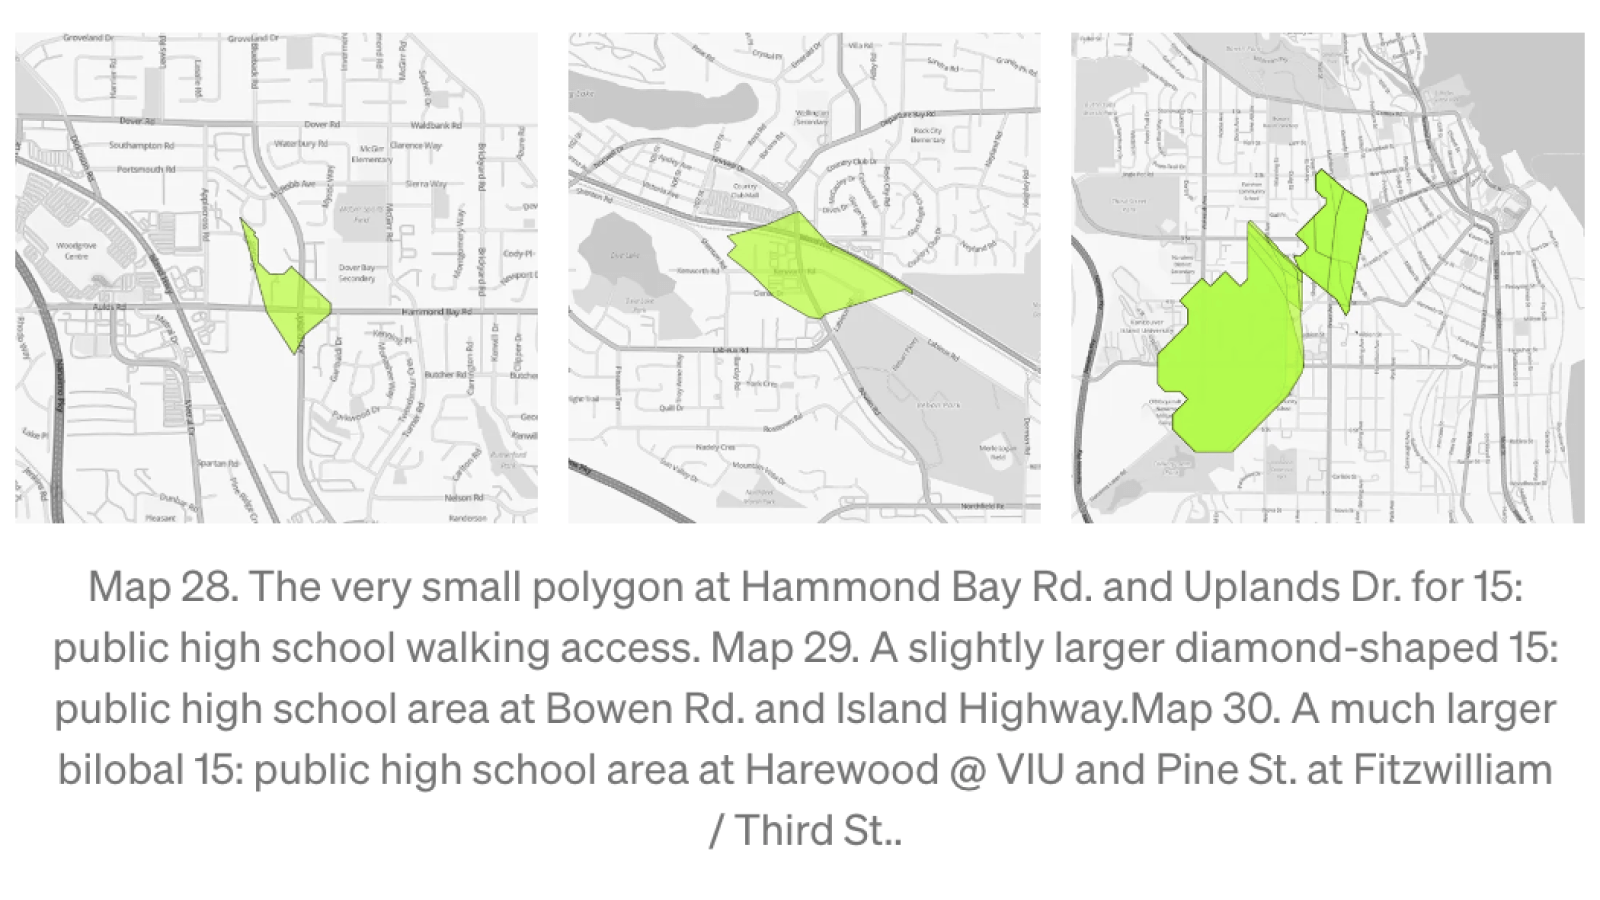
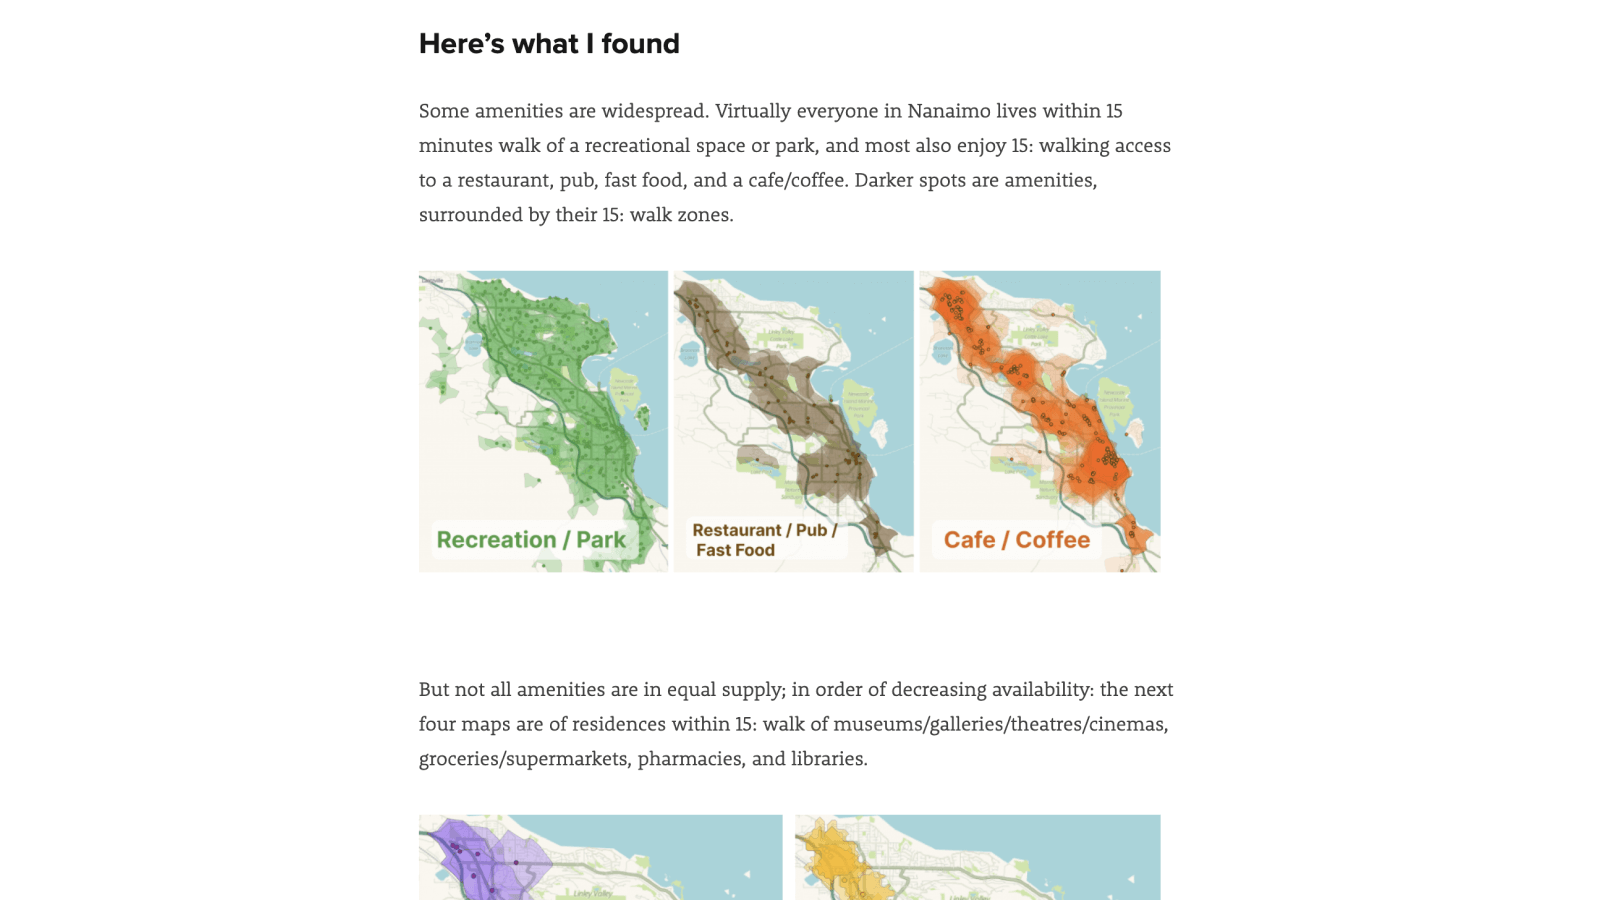
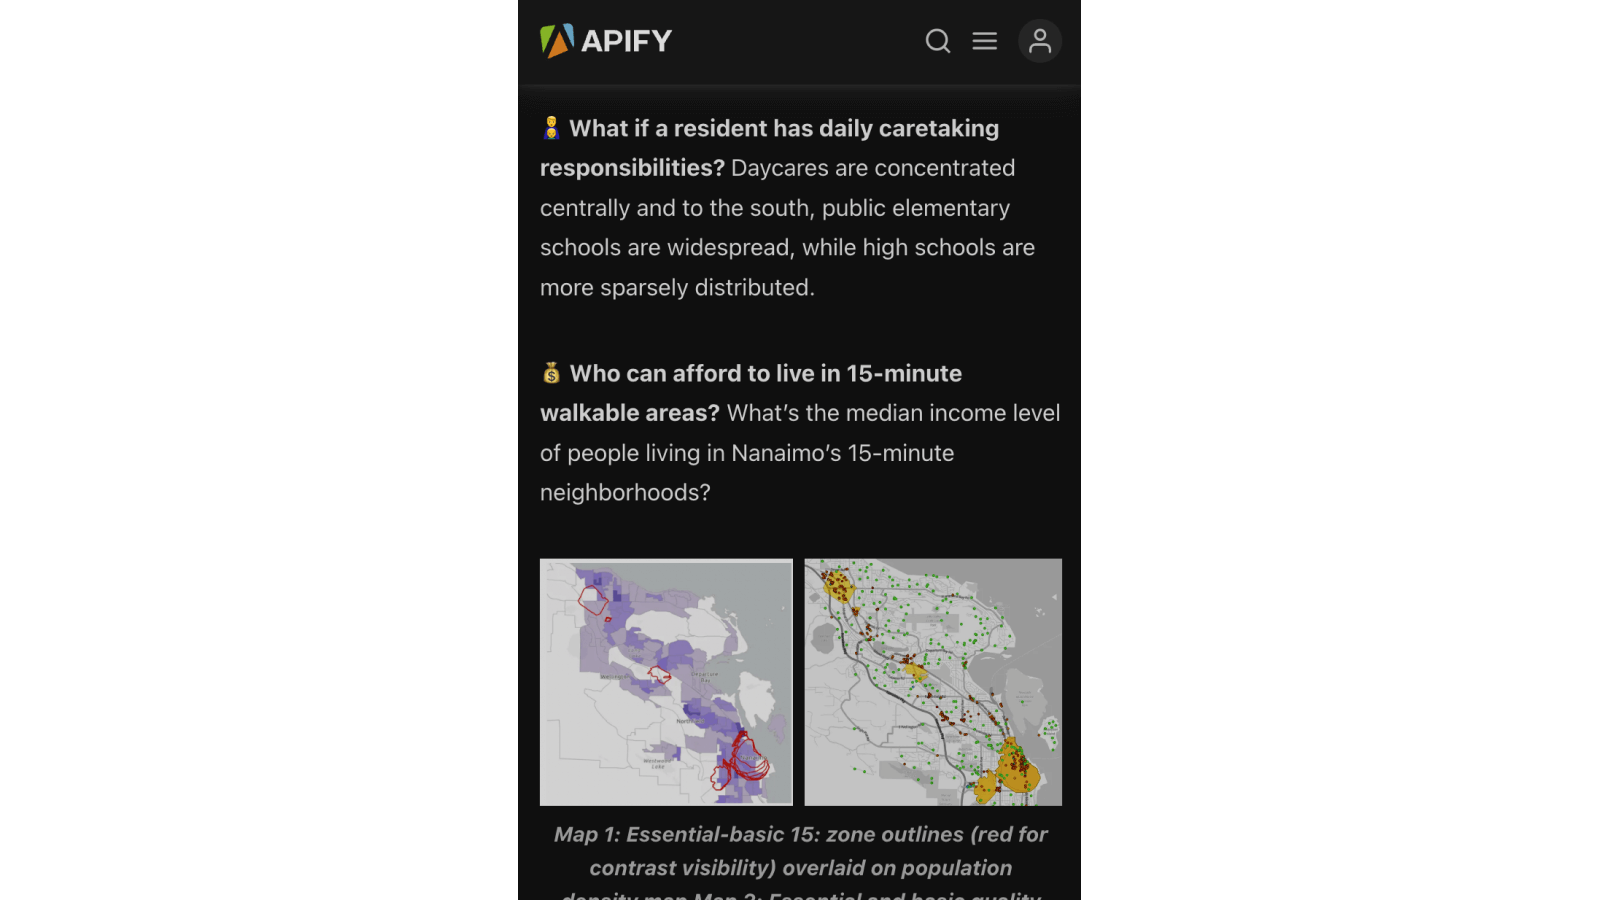
I based my “essential” amenities (shelter, medical care, grocery, and pharmacy) and “basic quality of life” amenities (recreational space, library, museum / gallery / theater / cinema, restaurant / pub, and cafe / coffee) on a Canada gov doc, geolocated them with Apify google maps scraper, mapped and isochrone-zoned using QGIS, and remapped in ArcGIS to overlay amenity 15: zones on median income household data and population density.
I based my “essential” amenities (shelter, medical care, grocery, and pharmacy) and “basic quality of life” amenities (recreational space, library, museum / gallery / theater / cinema, restaurant / pub, and cafe / coffee) on a Canada gov doc, geolocated them with Apify google maps scraper, mapped and isochrone-zoned using QGIS, and remapped in ArcGIS to overlay amenity 15: zones on median income household data and population density.
Results
Article in Spacing:Vancouver.
Picked up by Apify as a premium example of academic and urban planning research using
Apify
web scraping.